
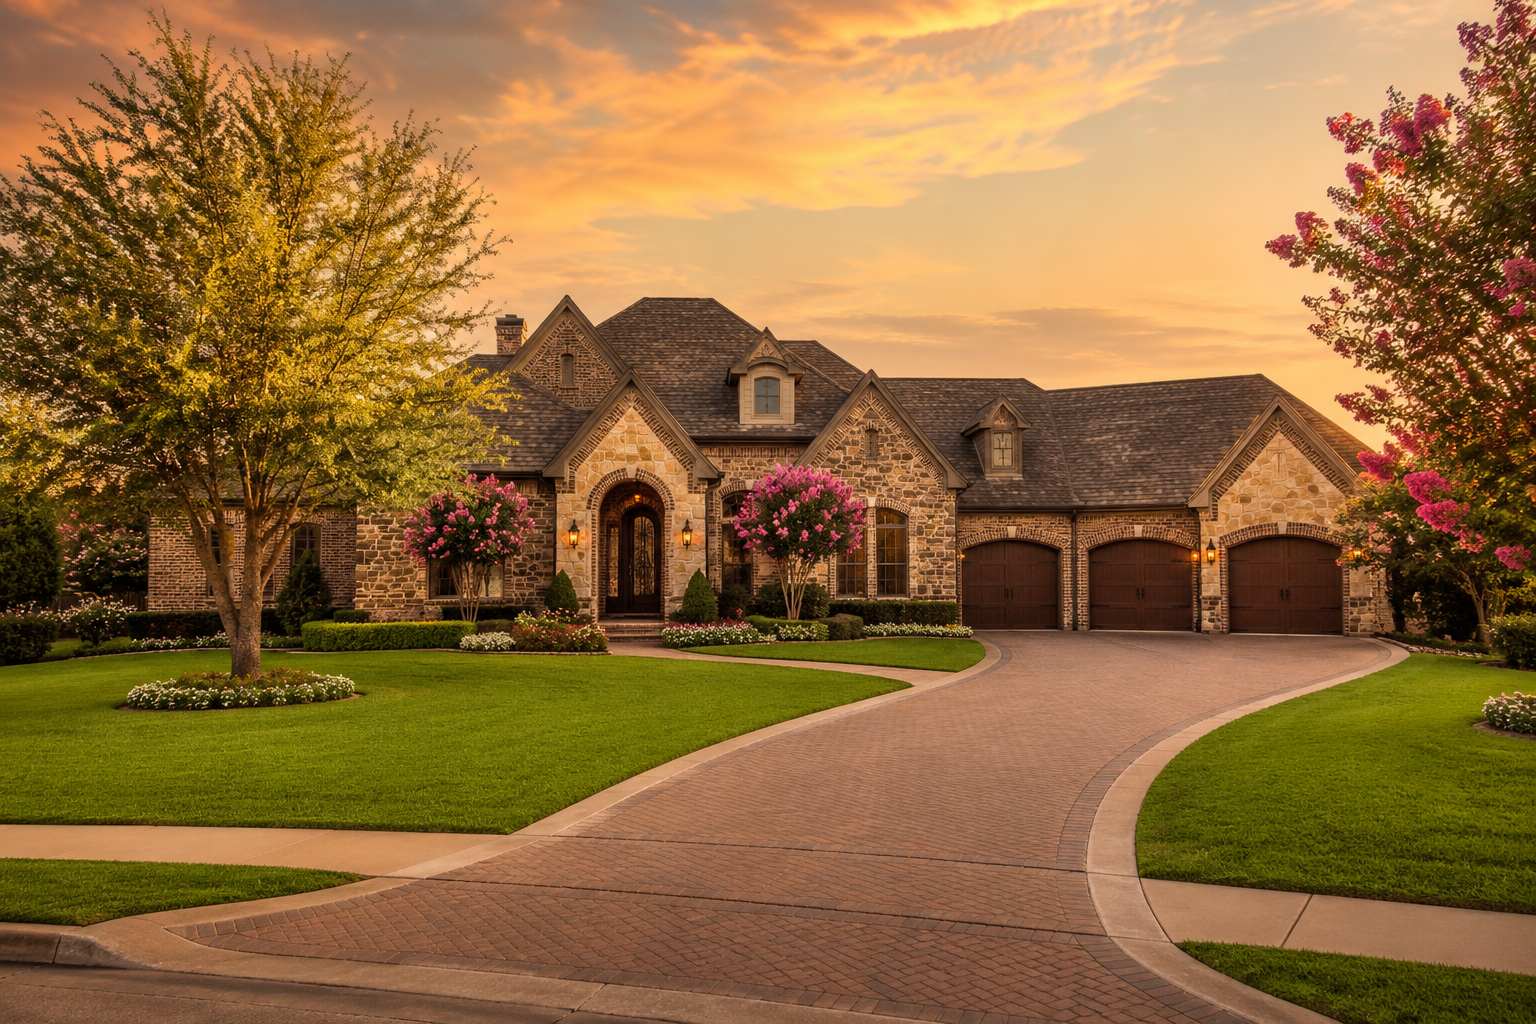
What Actually Happened This Summer — And What It Means If You Own a Home in Southlake
A homeowner-friendly guide built from real MLS data, prepared by Salsberry Property Management & Realty — your Southlake, Texas neighbors.
Why I Wrote This
Every summer, Southlake homeowners quietly ask the same question: "If I turned my house into a rental — or if I renewed my current tenant — what would it actually rent for right now, and is that different from last year?"
Most rental market content is written for investors with spreadsheets. This one isn't. This is written for you — the Southlake homeowner who's got a rental now, is thinking about renting your home out while you're away, or wants to understand your neighborhood's rental market well enough to make a smart decision. No jargon. No dressed-up opinion. Just the real numbers pulled straight from the MLS.
Everything below comes from actual closed leases in ZIP code 76092 for two matching windows:
- Summer 2026: June 1 through August 20, 2026 (this year, right now)
- Summer 2025: June 1 through August 20, 2025 (same window last year)
Same length, same geography, same data source. That's what makes the comparison honest.
The Big Picture, In One Line
Southlake is having one of the strongest rental summers we've measured this year — anywhere in DFW. Volume jumped 34% year-over-year, median rent rose nearly 6%, average rent rose 7.7%, and the sale-to-list ratio held at 100% for the second summer running. Newer construction homes had a genuinely exceptional summer. If you own a home in Southlake, this summer's data is very good news.
The Headline Numbers
Across all 55 closed leases in Southlake this summer (vs 41 last summer):
| Metric | Summer 2025 | Summer 2026 | Year-Over-Year |
|---|---|---|---|
| Median rent | $5,950 | $6,300 | +5.9% |
| Average rent | $5,956 | $6,415 | +7.7% |
| Median days on market | 17 | 21 | 4 days slower |
| Median $/sqft | $1.77 | $1.77 | Flat |
| Sale-to-list ratio | 100% | 100% | Unchanged |
| Total leases closed | 41 | 55 | +34% |
| Rent range | $2,075–$14,300 | $3,200–$15,450 | Both ends up |
Almost every meaningful indicator moved in the owner's favor. Volume grew substantially — 14 more homes leased in the identical summer window. Median rent grew nearly 6%. The rent range shifted upward at both ends: the floor rose from $2,075 to $3,200 (bottom-end rentals essentially disappeared), and the ceiling pushed past $15,000.
The one number that stayed exactly where it was: sale-to-list at 100%. Homes in Southlake leased for what owners were asking. Owners aren't discounting to close leases — the market is meeting them at their price, and there's more of that market than there was last summer.
Download the full 4-page PDF report →
The Real Story — Newer Homes Are Driving This
The single most striking story in the data is what's happening in the newer construction segment.
Newer construction (2010 and later) — the standout
- Summer 2025: 3 homes leased, median rent $5,500, median days on market 14
- Summer 2026: 11 homes leased, median rent $8,000 (+45.5%), median days on market 17
That's not a rounding error. Newer Southlake homes — the modern builds in the recent developments, some of the luxury townhomes in the mixed-use districts, and newer single-family builds — went from a small niche last summer to a substantial share of the market this summer, at meaningfully higher rents. This segment includes homes at 350 Central Ave, 1530 Meeting St, 704 Winding Ridge, and 909 Jamestown — many at $8,000 to $12,000 rents.
What that means for you: if you own a newer Southlake home (built 2010 or later), you're in the strongest specific segment of the market right now. Demand is real, and pricing has moved.
Established Southlake (pre-2010) — steady and healthy
- Summer 2025: 38 homes leased, median rent $5,975, DOM 18
- Summer 2026: 44 homes leased, median rent $6,125 (+2.5%), DOM 25
The bulk of Southlake's rental inventory is in established neighborhoods — Timarron, Stone Lakes, Woodland Heights, Timber Lake, Monticello, Chapel Downs, and the surrounding master-planned communities. These homes had a healthy summer too: more homes leased, rents rose modestly, sale-to-list held. The one caveat is that days on market widened by about a week, meaning marketing windows are running slightly longer than last summer for established homes.
By Bedroom Count
If you own a Southlake home, this is where you probably want to look:
| Home Type | Summer 2025 Median | Summer 2026 Median | YoY Change |
|---|---|---|---|
| 3 Bedroom (n=9→9) | $3,500 | $3,700 | +5.7% |
| 4 Bedroom (n=18→29) | $5,975 | $6,200 | +3.8% |
| 5 Bedroom (n=13→17) | $6,995 | $7,000 | Flat |
Three-bedroom rents rose modestly. Four-bedroom volume grew substantially (18 to 29 homes) with a healthy rent bump. Five-bedroom rents essentially plateaued at $7,000 — the ceiling for the median 5-bedroom home hasn't moved, but volume grew.
The story here is that mid-range 4-bedroom family homes remain the workhorse of the Southlake rental market — the biggest segment by volume, growing, with rising rents. If you own one, this summer treated you well.
Where the Real Rent Growth Happened
Look at how the leases distributed across price tiers:
| Rent Tier | Summer 2025 | Summer 2026 | Change |
|---|---|---|---|
| Under $5,000 | 12 leases (29%) | 13 leases (24%) | +1 |
| $5,000 – $7,000 | 20 leases (49%) | 26 leases (47%) | +6 |
| $7,000 – $10,000 | 7 leases (17%) | 13 leases (24%) | +86% |
| $10,000+ | 2 leases (5%) | 3 leases (5%) | +1 |
The $7,000 to $10,000 tier nearly doubled. That's where the real momentum is: premium homes commanding meaningful rent, and more of them leasing. The high-end Southlake rental market is deeper than it was a year ago.
Days on Market — Slightly Longer, Still Fast
Median days on market widened from 17 to 21 — about a four-day increase. That's not a demand problem. Homes still leased at 100% of asking. But it does mean:
- 4-bedroom homes: 16 → 18 days (essentially unchanged)
- 5-bedroom homes: 15 → 26 days (slower)
- 3-bedroom homes: 19 → 34 days (slower)
- Newer homes: 14 → 17 days (steady)
- Established homes: 18 → 25 days (slower by about a week)
Overall Southlake still leases fast — median about three weeks. But the days-on-market widening is real, and it's more pronounced in the smaller (3BR) and larger (5BR) segments than in the meat-of-the-market 4-bedroom range.
What this means for your marketing window: if you're planning to list your home this fall, budget three to four weeks. If your home hasn't leased in 25 days, don't panic — that's now around median. If you're past 50 days without meaningful interest, that's usually a pricing or presentation signal.
What You Should Actually Do With This
If you're planning to rent your home out this fall:
- The market moved in your favor. Price to actual leased comps from this summer, not last summer.
- 100% sale-to-list means accurate pricing genuinely works — you don't need to underprice.
- Budget three to four weeks of marketing for well-priced homes.
- Newer homes (2010+) have the strongest pricing power right now. If yours is newer, don't be shy about pricing to the top of the recent comps.
If you have a tenant on renewal:
- For 3-bedroom and 4-bedroom homes, the market supports a modest rent increase. Nothing dramatic — think 3-5% — but the comps back it up.
- For 5-bedroom homes, holding rent (or a very small bump) is more appropriate. Rents plateaued at the top.
- For newer construction homes, there's a real case for meaningful rent adjustment upward on renewal.
- Retention matters. Losing a great tenant to reach for another $200/month rarely pencils out over 12 months.
If you're thinking about buying a rental in Southlake:
- The market is deep and it's growing. 34% more homes leased this summer than last, at higher rents, still at 100% sale-to-list.
- Newer construction is the strongest segment right now — worth prioritizing if the numbers work.
- Established 4-bedroom homes in Timarron, Stone Lakes, and Timber Lake continue to be reliable inventory.
- Southlake ISD demand isn't going anywhere. This underpins the whole rental market.
The Longer View
Southlake has always been one of DFW's premium rental markets, and the summer 2026 data tells a story of continued strength. The 34% volume growth isn't a mix-shift blip — it's the market absorbing more inventory at higher rents. The 5.9% median rent growth combined with 100% sale-to-list ratio suggests owners here are being met at their asking numbers by a market that has depth.
If you own a Southlake home, this summer was excellent by almost any measure. Your specific numbers depend on which pocket, which size, and which vintage you own — but the underlying story is that your market is thriving.
Get Your Free Rental Analysis
The medians and averages in this report are useful. They aren't the same thing as the number your specific home should rent for. If you own a home in Southlake — or you're wondering what yours would realistically rent for right now — we're happy to give you a free, no-obligation rental analysis with:
- Real comparable leases from your specific neighborhood and home type
- An honest read on what your home should rent for this fall
- The one or two improvements most likely to move the number
- A realistic expectation on how long it'll take to lease
Request one anytime at salsberrypropertymanagement.com, or download the full 4-page PDF report to keep the full breakdown on hand.
Methodology
Data pulled from NTREIS MLS on August 25, 2026. Filter: Property Type = Residential Lease, MLS Status = Closed, Postal Code = 76092. Summer 2026 window: 06/01/2026 – 08/20/2026 (55 records parsed). Summer 2025 window: 06/01/2025 – 08/20/2025 (41 records parsed). All statistics are medians unless otherwise labeled. Data represents actual signed leases, not asking rents.