
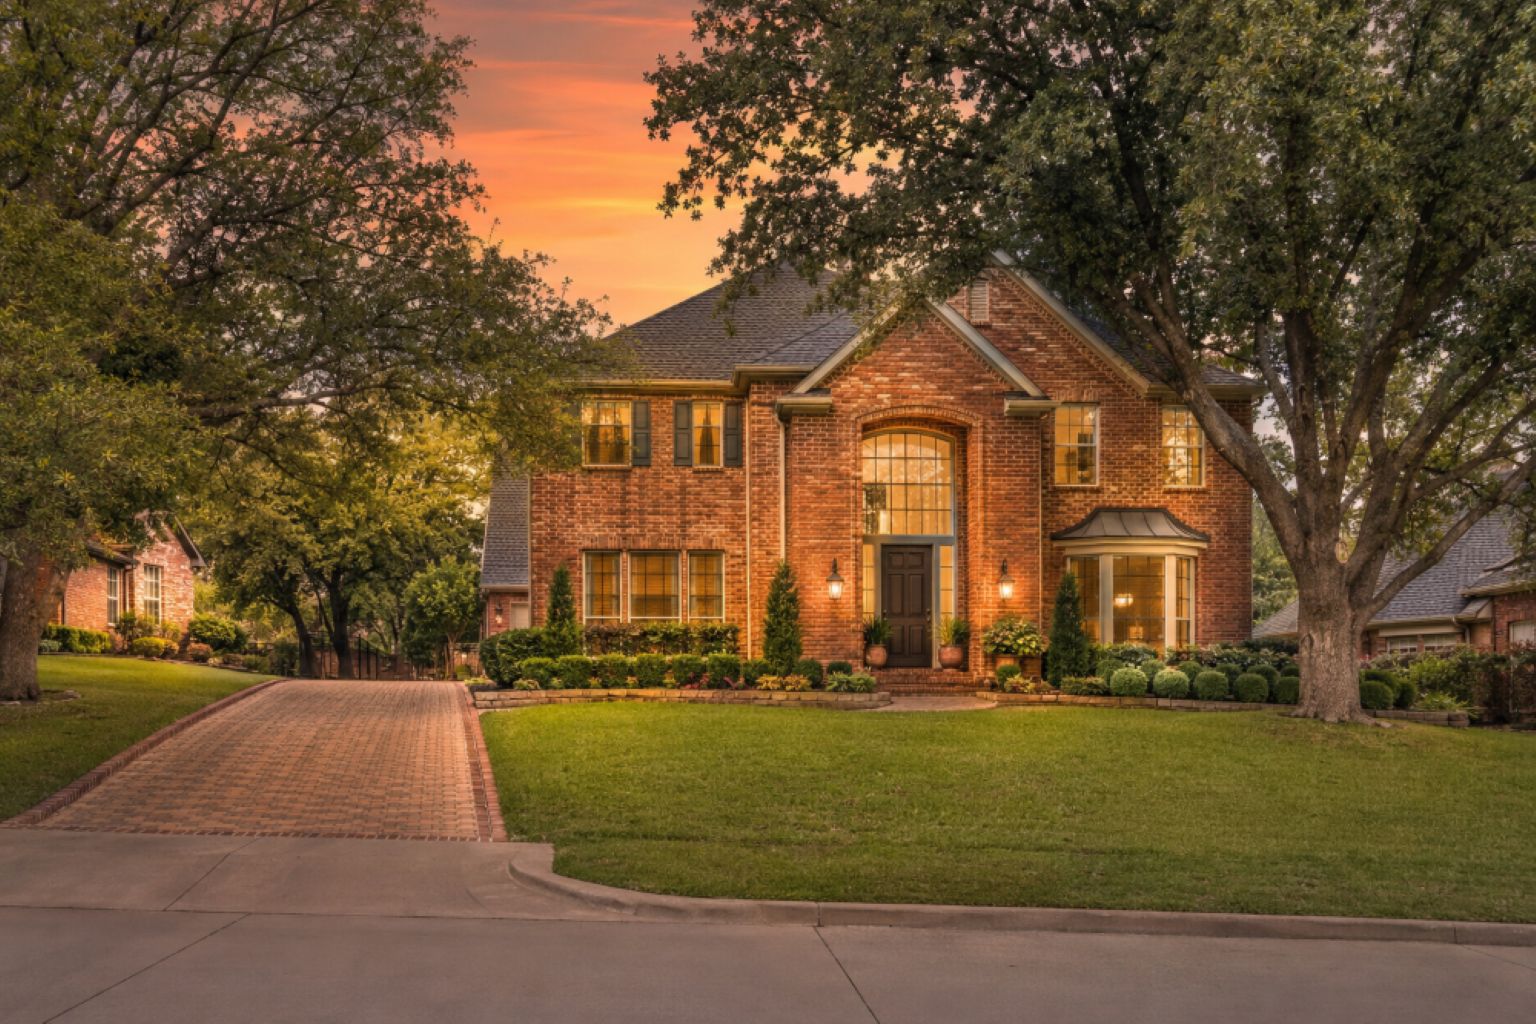
What Actually Happened This Summer — And What It Means If You Own a Home in Keller
A homeowner-friendly guide built from real MLS data, prepared by Salsberry Property Management & Realty — your Keller, Texas neighbors.
Why I Wrote This
Every summer, Keller homeowners quietly wonder the same thing: "If I turned my house into a rental — or if I renewed my current tenant — what would it actually rent for right now, and is that different from last year?"
Most rental market content is written for investors with spreadsheets. This one isn't. This is written for you — the Keller homeowner who's got a rental now, is thinking about renting your home out, or wants to understand your neighborhood's rental market well enough to make a smart decision. No jargon. No dressed-up opinion. Just the real numbers pulled straight from the MLS.
Everything below comes from actual closed leases in ZIP code 76248 for two matching windows:
- Summer 2026: June 8 through August 27, 2026 (this year, right now)
- Summer 2025: June 8 through August 27, 2025 (same window last year)
Same length, same geography, same data source. That's what makes the comparison honest.
The Big Picture, In One Line
Keller had a smaller but genuinely stronger rental summer. Volume was down 37% (57 leases in 2025 vs 36 leases in 2026), but the homes that did lease commanded meaningfully higher rents — median up nearly 11%, average up more than 16%, and they leased faster too. Sale-to-list held at 100% for the second summer running. If you own a home in Keller, the picture is nuanced: fewer transactions overall, but real pricing power for the right kind of home.
The Headline Numbers
Across all 36 closed leases in Keller this summer (vs 57 last summer):
| Metric | Summer 2025 | Summer 2026 | Year-Over-Year |
|---|---|---|---|
| Median rent | $2,750 | $3,050 | +10.9% |
| Average rent | $2,825 | $3,281 | +16.1% |
| Median days on market | 32 | 22 | 10 days faster |
| Median $/sqft | $1.39 | $1.41 | +1.4% |
| Sale-to-list ratio | 100% | 100% | Unchanged |
| Total leases closed | 57 | 36 | −36.8% |
| Rent range | $1,375–$5,200 | $1,289–$7,000 | Ceiling up sharply |
The volume drop is real and worth acknowledging — 21 fewer homes leased this summer than last. That could mean two things: either fewer Keller owners chose to rent their homes this year (many are choosing to sell in a strong sale market), or fewer tenants sought this specific corner of the market. Either way, the tenants who did lease homes in Keller this summer were paying meaningfully more than last year.
The rent ceiling pushed to $7,000 for the first time — the top-end Keller rental market has real depth this year. And homes leased 10 days faster on average.
The one constant: sale-to-list at 100% both years. Homes leased for what owners were asking. Owners aren't discounting.
The Real Story — Larger and Newer Homes Are the Standout
5-Bedroom Homes — the biggest story
- Summer 2025: 7 homes leased, median rent $3,750, DOM 41 days
- Summer 2026: 4 homes leased, median rent $5,350 (+42.7%), DOM 16 days
The 5-bedroom segment is a small sample, but the trend is unmistakable. Bigger family homes in Keller — the ones with room for a growing family, home offices, and space to spread out — are commanding dramatically higher rents this year. Not only that, they're leasing more than twice as fast (41 days down to 16). This is the standout segment.
4-Bedroom Homes — solid rent growth
- Summer 2025: 17 homes leased, median rent $3,200, DOM 34 days
- Summer 2026: 12 homes leased, median rent $3,800 (+18.8%), DOM 22 days
Four-bedroom homes — the workhorse of Keller's rental inventory — posted meaningful rent growth with a noticeably faster marketing window. If you own a well-kept 4-bedroom in an established Keller neighborhood, this summer's data supports a real rent adjustment.
3-Bedroom Homes — essentially flat
Summer 2025: 23 homes, median $2,400, DOM 21. Summer 2026: 17 homes, median $2,395, DOM 17. Three-bedroom rents held roughly flat. Slight softening at the median (−0.2%), but they leased faster. Stable segment.
2-Bedroom Homes — softer
Summer 2025: 8 homes, median $1,595, DOM 26. Summer 2026: 3 homes, median $1,495, DOM 116. Small sample, but the ones that leased took a lot longer to find tenants. This is the one segment where the market genuinely cooled.
Newer vs Established Construction
Newer homes (built 2015 or later): 2025: 2 leases, $4,150. 2026: 3 leases, $5,000 (+20.5%).
Mid-vintage (2000-2014): 2025: 14 leases, $3,498, DOM 38. 2026: 11 leases, $3,795 (+8.5%), DOM 16 — leasing much faster.
Established (pre-2000): 2025: 41 leases, $2,450. 2026: 22 leases, $2,392 (−2.3%).
The pattern is clear: newer and mid-vintage Keller homes had a great summer. Established pre-2000 homes softened slightly.
Where the Rent Growth Actually Happened
| Rent Tier | Summer 2025 | Summer 2026 |
|---|---|---|
| Under $1,750 | 9 leases (16%) | 4 leases (11%) |
| $1,750 – $2,500 | 14 leases (25%) | 8 leases (22%) |
| $2,500 – $3,500 | 20 leases (35%) | 8 leases (22%) |
| $3,500 – $5,000 | 12 leases (21%) | 11 leases (31%) |
| $5,000+ | 2 leases (4%) | 5 leases (14%) |
The center of the market ($2,500-$3,500) contracted sharply. The top end ($3,500+) grew as a share of leases, and the $5,000+ tier more than doubled. Fewer mid-market leases, meaningfully more premium leases.
Days on Market — Broadly Faster
Median days on market dropped from 32 to 22 — a 10-day improvement. That's a substantial move. It suggests that when a Keller home was priced right this summer, tenants moved quickly on it. The exception was 2-bedroom homes, which took much longer than last year.
What You Should Actually Do With This
If you're planning to rent your Keller home out this fall:
- Price to actual leased comps from THIS summer, not last summer.
- 100% sale-to-list means accurate pricing genuinely works — don't underprice.
- Expect a 2-4 week marketing window. Homes still leased at median 22 days.
- If your home is 4+ bedrooms and newer/well-kept, don't be shy about pricing at the top of your comps.
If you have a tenant on renewal:
- For 4-bedroom or 5-bedroom homes, the market strongly supports a meaningful rent adjustment upward — 5% to 10%+ is defensible.
- For 3-bedroom homes, holding rent flat (or a very modest increase) is the right call.
- For 2-bedroom homes, holding rent is appropriate — this segment softened.
- Retention still matters. A great long-term tenant is worth more than another $150/month.
The Longer View
Keller has always been a stable, mature rental market. This summer's data reinforces that story with an interesting twist: the market has bifurcated. Premium homes are commanding strong rents at 100% of asking. Sub-$2,500 inventory is more competitive. But across every segment, sale-to-list stayed pinned at 100%.
Get Your Free Rental Analysis
The medians and averages in this report are useful. They aren't the same thing as the number your specific home should rent for. If you own a home in Keller — or you're wondering what yours would realistically rent for right now — we're happy to give you a free, no-obligation rental analysis.
Request one anytime at salsberrypropertymanagement.com.
Methodology
Data pulled from NTREIS MLS on September 1, 2026. Filter: Property Type = Residential Lease, MLS Status = Closed, Postal Code = 76248. Summer 2026 window: 06/08/2026 – 08/27/2026 (36 records parsed). Summer 2025 window: 06/08/2025 – 08/27/2025 (57 records parsed). All statistics are medians unless otherwise labeled.