
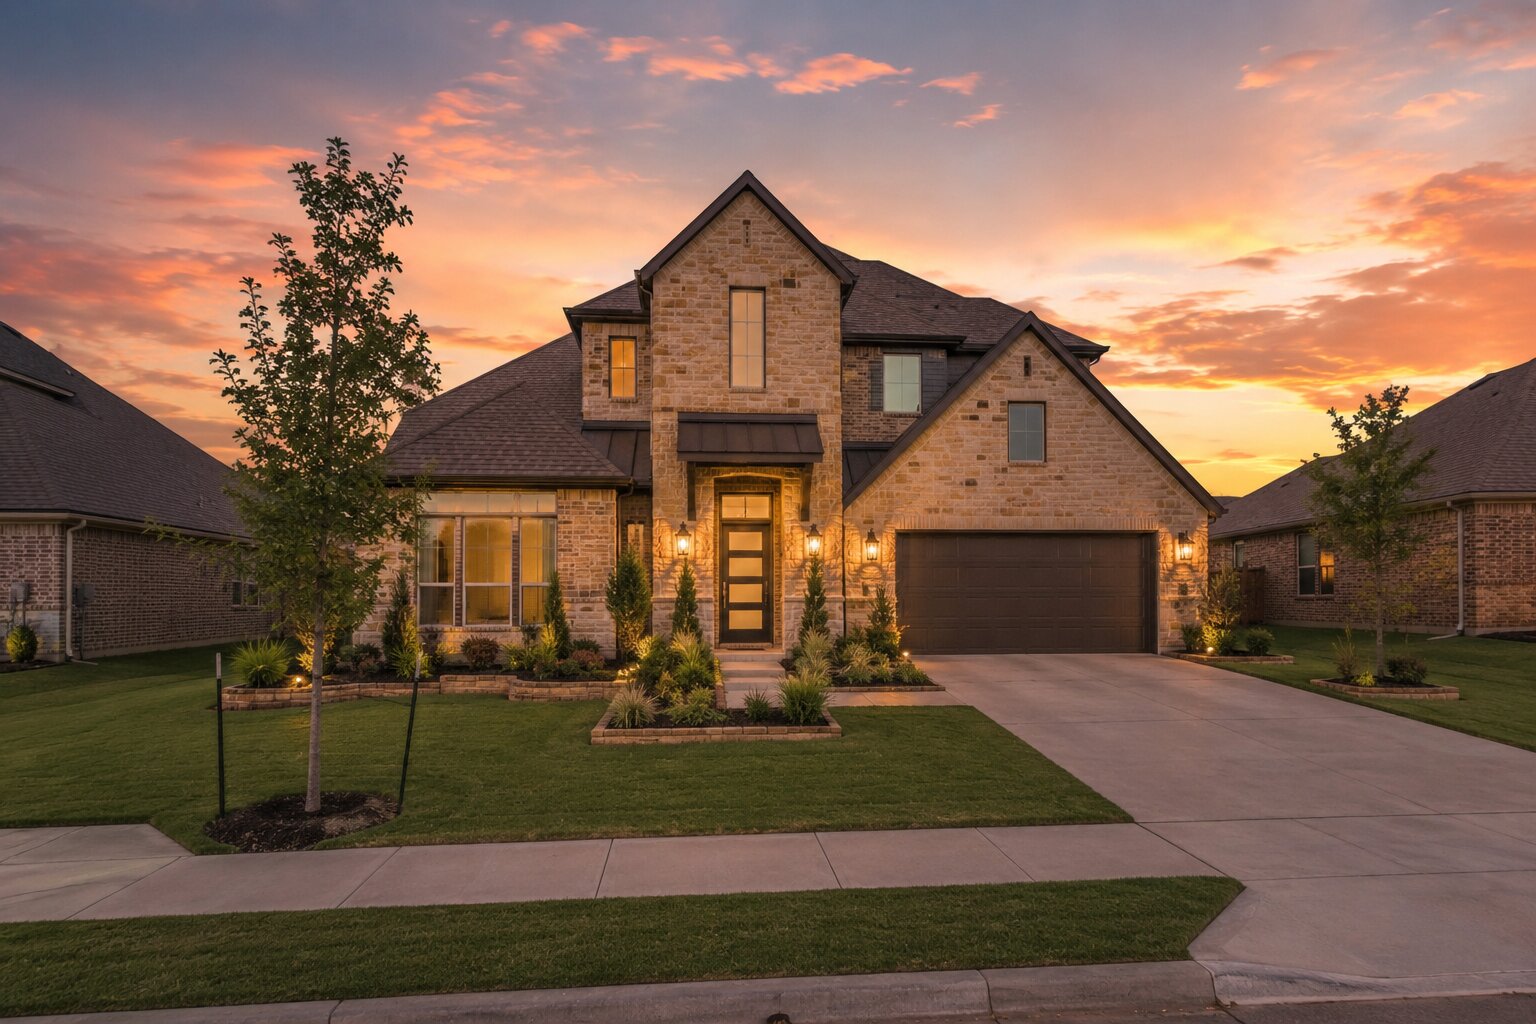
What Actually Happened This Summer — And What It Means If You Own a Home in North Fort Worth
A homeowner-friendly guide built from real MLS data, prepared by Salsberry Property Management & Realty — your North Fort Worth neighbors.
Why I Wrote This
Every summer, North Fort Worth homeowners quietly wonder the same thing: "If I turned my house into a rental — or if I renewed my current tenant — what would it actually rent for right now, and is that different from last year?"
Most rental market content is written for investors with spreadsheets. This one isn't. This is written for you — the North Fort Worth homeowner who's got a rental now, is thinking about renting your home out, or wants to understand your neighborhood's rental market well enough to make a smart decision. No jargon. No dressed-up opinion. Just the real numbers pulled straight from the MLS.
Everything below comes from actual closed leases across the greater North Fort Worth area — ZIP codes 76244, 76131, 76179, and 76052 — for two matching windows:
- Summer 2026: June 8 through August 27, 2026 (this year, right now)
- Summer 2025: June 8 through August 27, 2025 (same window last year)
Same length, same geography, same data source. That's what makes the comparison honest. This is the biggest dataset in our summer market series so far — nearly 1,200 closed leases combined between the two summers.
The Big Picture, In One Line
The North Fort Worth rental market is remarkably, almost eerily stable. Median rent held exactly flat at $2,250 both summers. Median days on market held exactly flat at 28. Median $/sqft held essentially flat at $1.22-$1.23. Sale-to-list ratio held at 100% both years. Volume was essentially flat — 605 leases in 2025 vs 584 in 2026 (down about 3%). This isn't a stalled market. It's a functional, mature, deeply liquid one that's absorbing new inventory smoothly.
The Headline Numbers
Across all 584 closed leases in the greater North Fort Worth area this summer (vs 605 last summer):
| Metric | Summer 2025 | Summer 2026 | Year-Over-Year |
|---|---|---|---|
| Median rent | $2,250 | $2,250 | 0.0% (flat) |
| Average rent | $2,320 | $2,358 | +1.6% |
| Median days on market | 28 | 28 | Unchanged |
| Median $/sqft | $1.22 | $1.23 | +0.8% |
| Sale-to-list ratio | 100% | 100% | Unchanged |
| Total leases closed | 605 | 584 | −3.5% |
| Median home size | 1,837 sqft | 1,844 sqft | Essentially flat |
| Median year built | 2010 | 2013 | Slightly newer mix |
A market with this much volume that is this precisely stable YoY is genuinely rare. When you have hundreds of leases in your comp pool, the numbers usually move at least a percent or two. The fact that everything held nearly identical suggests a market that's found its equilibrium and is absorbing new inventory (this area has significant ongoing construction, especially in the Alliance corridor) without price pressure in either direction.
The one thing that never moved: sale-to-list at 100% both years. Homes leased for what owners were asking.
What Each Corner Actually Did
The four ZIPs we included span several distinct submarkets:
Fort Worth-labeled (76131, 76179, and most of 76244) — the flat core
- Summer 2025: 538 leases, median rent $2,250, DOM 27
- Summer 2026: 472 leases, median rent $2,250 (flat), DOM 27
The overwhelming majority of North Fort Worth's rental inventory is here — Alliance corridor neighborhoods, master-planned communities north of the loop, and the residential build-out around WestBend, Champions Ridge, Marine Creek, and Presidio. This segment did essentially nothing YoY. It absorbed 66 fewer leases at exactly the same median rent, exactly the same time on market, exactly the same 100% sale-to-list.
Saginaw (76179 primarily) — modest rent growth
- Summer 2025: 47 leases, median rent $2,150, DOM 37
- Summer 2026: 59 leases, median rent $2,300 (+7.0%), DOM 33
Saginaw quietly had a very good summer. More homes leased (up 25%), at meaningfully higher rents (+7%), and marketing windows tightened.
Haslet (76052) — softened
- Summer 2025: 18 leases, median rent $2,468, DOM 46
- Summer 2026: 50 leases, median rent $2,284 (−7.4%), DOM 38
Dramatically more inventory leased (18 to 50 leases) but at meaningfully lower median rents. Some of this is mix-shift — the additional inventory that leased this year skewed smaller and cheaper. Time on market improved. Sale-to-list held at 100%.
By Bedroom Count
| Home Type | Summer 2025 Median | Summer 2026 Median | YoY Change |
|---|---|---|---|
| 2 Bedroom (n=7→6) | $1,600 | $1,588 | Essentially flat |
| 3 Bedroom (n=328→289) | $2,100 | $2,100 | Exactly flat |
| 4 Bedroom (n=237→262) | $2,395 | $2,435 | +1.7% |
| 5 Bedroom (n=33→25) | $2,995 | $2,998 | Flat |
The consistency here is what stands out. Three-bedroom rents were exactly identical. Five-bedroom rents were essentially identical. Four-bedroom homes — the biggest single segment — gained a modest 1.7%.
Days on Market — Identical Overall
Overall median days on market held at exactly 28 days both summers. That's about a four-week marketing window for the typical North Fort Worth rental. The one segment that meaningfully slowed was 5-bedroom homes, which extended from 27 to 37 days.
Newer vs Older Construction
Newer (2015+): 255 → 282 leases, $2,350 → $2,310 (−1.7%). Softened slightly — this segment has the most competing new inventory.
Mid-vintage (2000-2014): 311 → 263 leases, $2,195 → $2,200 (flat). Workhorse.
Older (pre-2000): 39 → 39 leases, $1,915 → $1,995 (+4.2%). Modest gains.
What You Should Actually Do With This
If you're planning to rent your home out this fall:
- The market is stable. Price to actual leased comps — they're essentially the same as last year's.
- Expect a 4-week marketing window. That's median.
- 100% sale-to-list means accurate pricing genuinely works.
- If your home is newer construction, be careful not to overprice.
- If your home is older (pre-2000) or in Saginaw specifically, the market supports slightly stronger pricing.
If you have a tenant on renewal:
- For 3-bedroom and 5-bedroom homes, holding rent flat is probably the right call.
- For 4-bedroom homes, a modest 2-3% rent adjustment is supportable.
- For Saginaw-labeled homes, meaningful rent adjustment (5-7%) is defensible.
- Retention is worth more here than in most markets.
The Longer View
This submarket is one of DFW's most important — it's where most of the region's new home construction has been happening for over a decade, and where a huge share of DFW's employment growth (Alliance, Amazon, Charles Schwab, and the surrounding corporate corridor) lives. The summer 2026 data tells a story of that market maturing: absorbing new inventory smoothly, without price pressure, at consistent time-on-market.
If you own a home here, the summer 2026 outcome is essentially "the same as last summer." That's actually good news.
Get Your Free Rental Analysis
The medians and averages in this report are useful. They aren't the same thing as the number your specific home should rent for. If you own a home in the greater North Fort Worth area — or you're wondering what yours would realistically rent for right now — we're happy to give you a free, no-obligation rental analysis.
Download the full 4-page PDF report
Request one anytime at salsberrypropertymanagement.com.
Methodology
Data pulled from NTREIS MLS on September 1, 2026. Filter: Property Type = Residential Lease, MLS Status = Closed, Postal Code = 76244, 76131, 76179, or 76052. Summer 2026 window: 06/08/2026 – 08/27/2026 (584 records parsed). Summer 2025 window: 06/08/2025 – 08/27/2025 (605 records parsed). All statistics are medians unless otherwise labeled.